

5 Years of India’s Landmark Clean Air Programme: 5 Takeaways Show How Far it's Worked
A billion dollars on, has air pollution reduced? Varanasi, Chennai met targets. Delhi, Bengaluru, Kolkata missed targets. Mumbai worsened. And even the cleanest cities exceed WHO's 'safe' limit.

By this year, air pollution in 131 cities of India was to have been cut by 20-30% as per the first National Clean Air Programme (NCAP) announced in 2019. NCAP’s now completed five years exactly. The cities identified had pollution consistently above permissible levels based on the Indian government and WHO’s data. A wake up call came in 2014 when WHO listed Delhi as the most polluted city in the world, worse than Beijing.

NCAP’s initial target and deadline have been extended to 40% by 2026. However, a new study by Climate Trends and Respirer Living Sciences has analysed the five year data. The results are a mixed bag. For PM 2.5, the report analysed 92 cities which had continuous ambient air quality monitors (CAAQMS) and reported data for more than half the time annually.
There is some improvement but levels in all 92 cities are above the WHO’s annual ‘safe’ limit of 5 micrograms/cubic metre for PM 2.5, a microscopic and most tracked pollutant. It has a devastating impact on health which may range from heart attacks, strokes, high blood pressure, asthma to dementia and cognitive development. As it is more damaging than the larger PM 10 particular matter, this article focuses on PM 2.5.
Here then are five takeaways from the ‘Five Years of NCAP’ analysis to understand the progress (or lack of it).
#1: National Clean Air Programme goal met in 16 of 92 cities
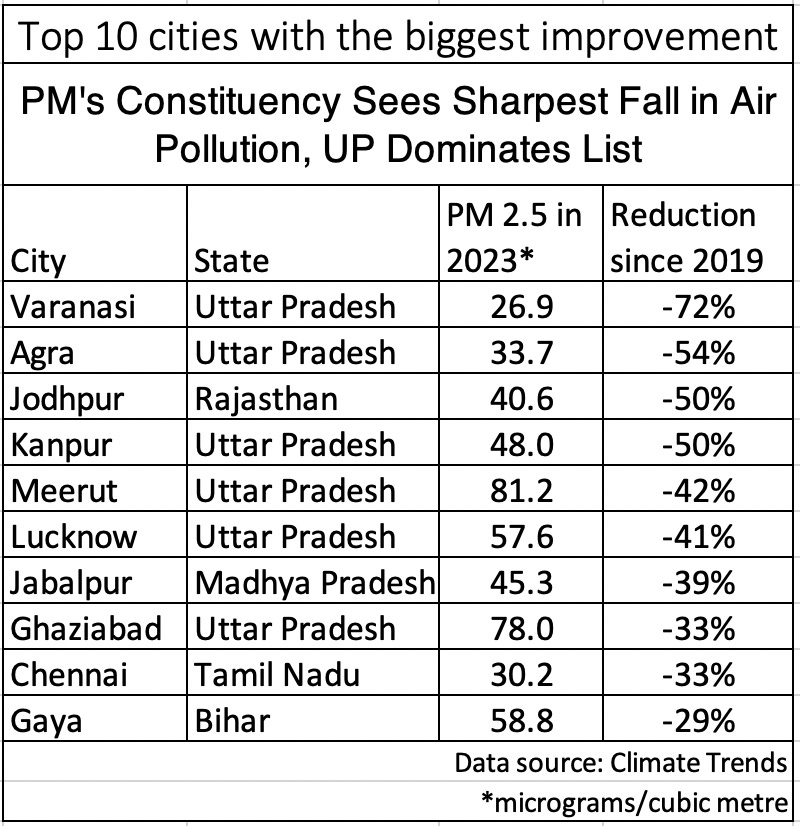
Six cities have already met the 2026 target. Topping this list is Varanasi which happens to be Prime Minister Narendra Modi’s parliamentary constituency. The other five cities are in the same northern state of Uttar Pradesh (UP) except for Jodhpur in Rajasthan, a popular destination for global celebrity weddings.
Varanasi’s PM 2.5 pollution level fell by 72% in five years to an annual average of 26.9 microgram/cubic metre in 2023. Ten other cities met the 2024 target of reducing pollution by 20-30%.
The cleanest air was in Silchar, Assam, where PM 2.5 was only 9.6 micrograms, will within the 30 which is the limit for ‘good’ air according to India’s pollution control board but twice the WHO’s ‘safe’ limit.

#2: Pollution increased in 22 cities
Air pollution increased in as many as 22 cities compared to 2019. These hikes range from under 10% to almost 50% in some places.
What’s notable is that these 22 cities are from a list of 49 cities for which five-year data is available; for the remaining 43 of these there is no data in 2019.

#3: Usual suspects dominate most polluted cities
Coming to the most polluted cities, there are few surprises. The usual suspects dominate.
The top 20 most polluted cities are from 12 states and union territories, spread right across the sub-continent from Punjab in the west to Assam in the east, from the Himalayan state of Himachal Pradesh to Odisha on the Bay of Bengal coast.
In these five years Delhi has taken over the top spot as the most polluted city, in place of Ghaziabad, a UP town bordering east Delhi. The Indian capital’s PM 2.5 averaged 102 micrograms/cubic metre last year, a marginal decrease of 5.9% compared to 2019 (although, notably, Delhi’s pollution rose compared to 2022.) This despite the fact that there has always been great focus on Delhi’s air pollution. Back in 2019 there were 134 real-time air quality monitors, and 38 of them in Delhi, whereas UP, which is many times larger and more populated had only 15; UP now has more.
In fact, in 2019 Ghaziabad was the world’s most polluted city, but its pollution level has fallen by a third. Its air pollution control measures took a curious turn with reports on controversial ways allegedly adopted to lower pollution data, including spraying water at a monitoring site and relocating a monitor out of a congested area to a greener place.
Aarti Khosla, Director, Climate Trends
“The National Clean Air Programme has made noteworthy progress in tackling air pollution, witnessing notable reductions in PM2.5 and PM10 levels in top polluted cities, showing there have been efforts underway. Despite these positive strides, persistent challenges exist, with some urban areas facing an uptick in pollution concentrations. The program's revised goal of a 40% reduction in particulate matter by 2026 reflects a commitment to ambitious environmental targets.”
#4: Mumbai, Jaipur, Amritsar see among sharpest % rise in pollution
The report says the cities experiencing the greatest increases in concentrations from 2019 to 2023 include Navi Mumbai (46%), Ujjain (46%), and Mumbai (38%) for PM2.5. Navi Mumbai’s PM2.5 went up from 38.8 ug/m3 to 56.9 ug/m3. Ujjain’s PM2.5 increased from 43.7 ug/m3 to 64 ug/m3, and Mumbai’s levels went up from 35.8 ug/m3 to 49.5 ug/m3.
Ujjan’s rose by 47% to 64 ug/m3, Amritsar and Ludhiana - both in the heart of Punjab’s stubble burning region - by 18 and 15%, and Talcher in Odisha, home to India’s largest coal field, by 13%. The annual average of PM 2.5 in Jaipur, a tourist favourite, rose to 55.6 micrograms, a rise of 13%.

#5: More Funding = Less Pollution?
Perhaps the greatest challenge in reducing air pollution is revealed in the funding. Almost Rs 9,650 crores (over $1 billion at the current exchange rate) has been released but 40% of this remains unspent as per recent government data.
More research is required to understand if funds are being used effectively. A lot could also depend upon local factors ranging from implementation to meteorological. For instance, both Greater Mumbai and Kolkata spent over Rs 600 crores. But PM 2.5 levels rose 38% in the former and fell 16.7% in the latter. Varanasi spent only about a third of its Rs 229 crores but improved the most, 72%.
Delhi, despite being the most polluted, got only about Rs 38 crores, which is less than 51 other cities listed. And it spent only about Rs 10 crores.
Over Rs 540 crores was released for Bengaluru, it spent only 1% and pollution dipped 2%.

The data and NCAP policy will no doubt be analysed much more given the complexities and nuances involved. But it’s evident that a lot more needs to done to speed up reduction in air pollution.